

Nonprofit Financial Dashboards
Need to engage your board and management in your organization’s finances?
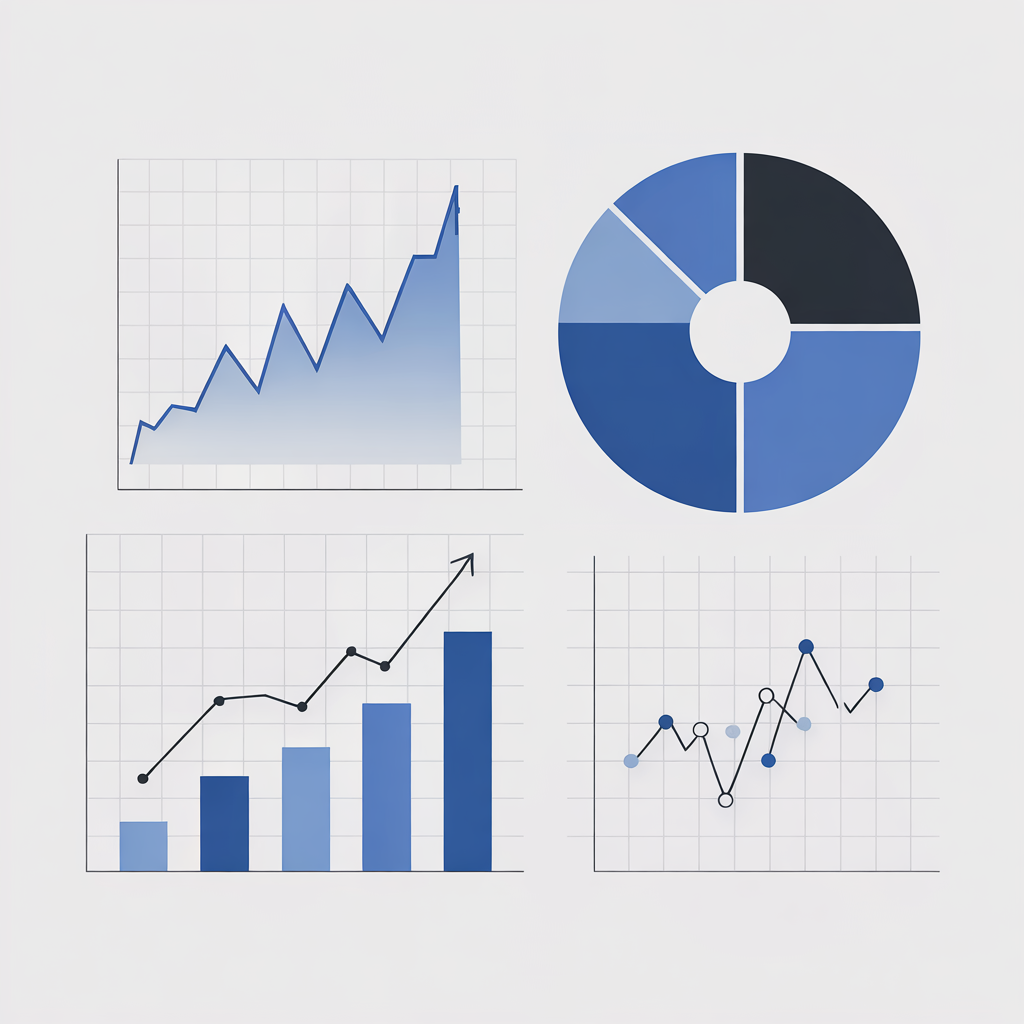
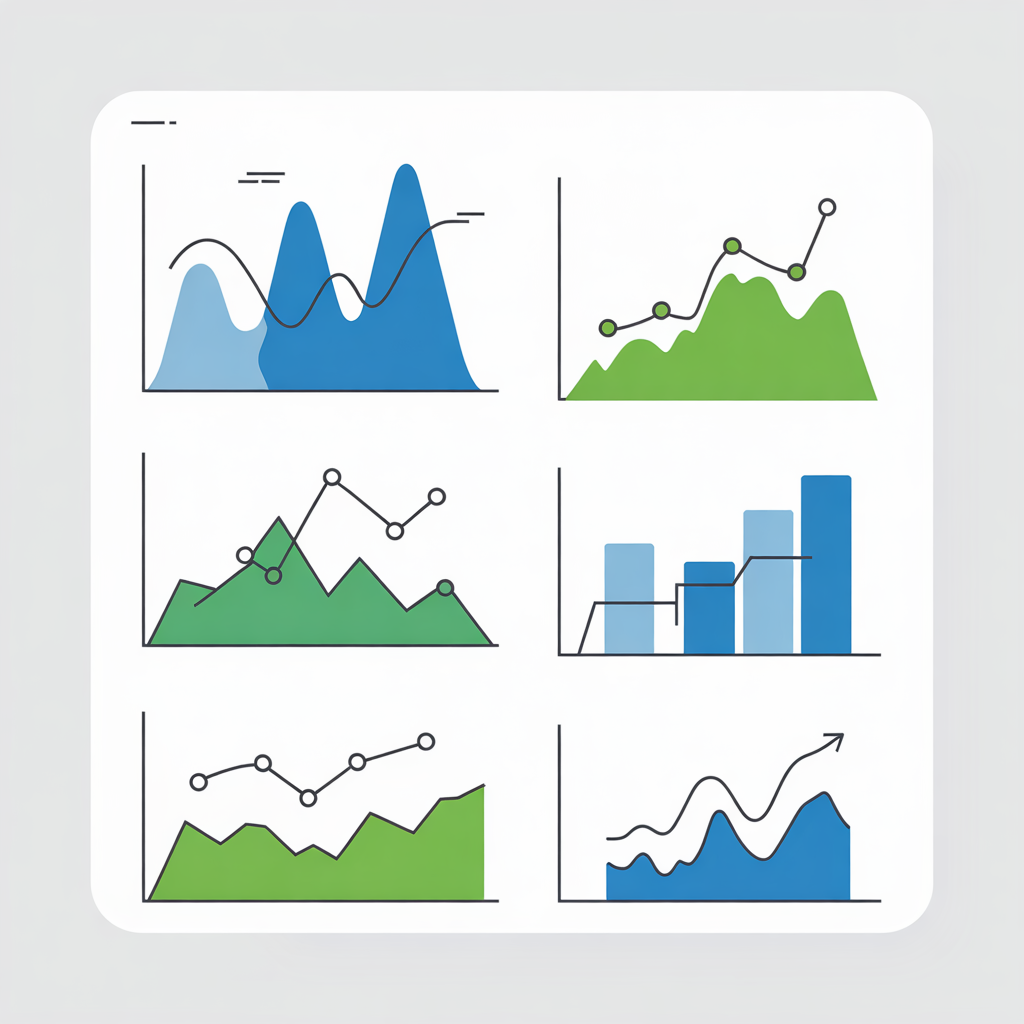
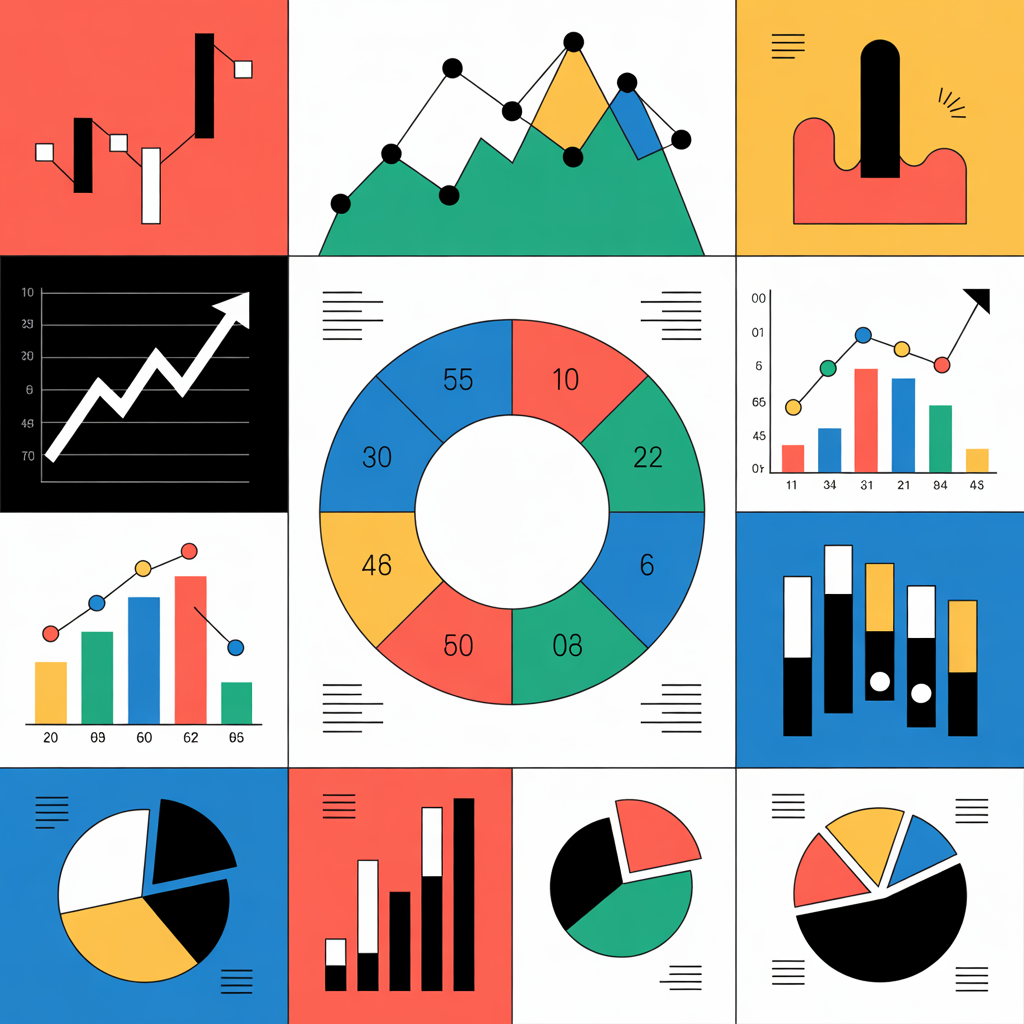
A graphic financial dashboard converts confusing numbers into accessible charts and graphs.
Nonprofit CFOs can help provide the expertise and technical support you need to build the right dashboard to tell your organization’s story.
Your basic starter kit to build a nonprofit financial dashboard. You'll transform basic measures of your nonprofit's financial health into graphics that are easier to comprehend.
Everything in the basic package plus enough consultant time to customize the dashboard to your nonprofit's unique needs, preferences, and priorities.
Includes everything in the enhanced package, plus consultant time to explore major changes and broader success metrics beyond finances, such as programs and fundraising.
Please take a moment to review Nonprofit CFO’s Terms of Service
FAQs
-
The dashboard template is built in Excel. You will export your balance sheet and profit & loss reports, in xls or csv format, and then copy and paste it into the template. This is an easy, standard operation in Quickbooks and most other accounting software systems.
-
The template includes 8 common measures of financial health, including: Cash & Equivalents, Accounts Receivable (money owed to us), Accounts Payable (bills due soon), Unrestricted Cash, Revenue, Expenses, Revenue Sources, and Expenses by type. All of these should be easy to update with data from QuickBooks and other common software packages. We’ve found that these particular measures work well to begin a nonprofit’s internal conversation about “what are our most important measures of financial health?” Although most organizations will use some of the above 8 measures, many will do some customization to align with their unique circumstances and priorities.